Super Bowl 58 simulation
Super Bowl Sunday, and the whole two-week leadup for that matter, has become widely known as a time period to take advantage of a ton of prop betting options that aren’t available for the average NFL game. Bettors can wager on specific play results, team & individual stats, and plenty, plenty more. I’m here to address the individual stats option, using some statistical forecasting methods that I’ve learned over the years in studying sports data. I will apply this knowledge to Sunday’s Kansas City-San Francisco matchup in Super Bowl LVIII.
Having served as an oddsmaker for over 10 years, I’ve used these methods in my submissions for some of the world’s most noteworthy sportsbooks. That said, rest assured that the numbers you will see below are my own projections and weren’t shared with any other industry operative on either side of the counter. Keep in mind that I did this same thing the last three years, and the score projections pointed to a Tampa Bay outright win over Kansas City in 2021, then a tight LA Rams win a year ago, as well as Unders on both game totals. In other words, on sides and totals, I was 4-for-4. However, last year the numbers did project a Philadelphia win, and for as much as the Eagles did outplay the Chiefs for most of the game, that didn’t happen. Still, because the yardage and play totals had the look of a game that the Eagles should have won, most of my prop projections did very well. Hopefully this year’s figure put it all together once again.
In this piece I will start by projecting the scores, time of possession, and yardage statistics for the Super Bowl LVIII contest overall, and then expand into the individual players and their projected output based upon these overall numbers. For enhanced accuracy, I have only utilized the last 10 meaningful games for each team, making the assumption that the performances in that span were more indicative of the teams’ themselves and the quality of opponents which they faced. I’ve made appropriate adjustments for where the teams had or played against teams with injured star players. For the record, I did ignore the regular season finales for both Kansas City & San Francisco, as each opted to rest numerous starters for those games.
Let’s start by looking at some overall projections for the game, using my EFFECTIVE STATS method as the basis for calculation. This method takes into account the team’s performance against weighted averages of its opponents. In other words, STRENGTH OF SCHEDULE is built in.
Overall Game Score using Effective Scoring Calculations
To show you an example of how I calculate the EFFECTIVE SCORE projections based upon the L10 analyzed games, here are the last 10 game Effective Points For/Against for both teams. I will only show the 10-game numbers for this first calculation to illustrate how I’ve done it:
Kansas City Effective Offensive Points for L10 games: 14.92, 33.74, 19.06, 18.98, 27.86, 15.24, 24.74, 24.34, 30.14, 23.42
San Francisco Effective Offensive Points for L10 games: 34.11, 30.61, 29.99, 36.87, 27.09, 39.19, 26.18, 19.86, 24.08, 31.36
Using my forecast model, here are the Effective Offensive Points projections for SB LVIII:
Kansas City: 25.99
San Francisco: 25.23
Applying the same statistical methods for the defensive performances…
Kansas City Effective Defensive Points for L10 games: 18.14, 18.79, 26.24, 16.81, 26.82, 22.1, 16.52, 6.19, 20.17, 7.72
San Francisco Effective Defensive Points for L10 games: 2.8, 14.87, 13.41, 16.41, 20.12, 31.57, 25.48, 11.4, 20.41, 24.28
Using the same forecast model, here are the Effective Defensive Points projections for SB LVIII:
Kansas City: 11.62
San Francisco: 26.76
I, along with a few of my statistical colleagues in the industry, typically estimate that about 2/3 of the “scoring output” is dictated by the offenses. Using that ratio, the score projection would be:
Last 10 Games Effective Scoring Forecast:
Kansas City: 26.25
San Francisco: 20.69
The total points of 46.94 is a little less than a point below the actual total of 47.5, and the Chiefs would be expected to be about a 5.6-point favorite. This obviously dramatically exceeds the actual line being offered. Incidentally, the last time this model projected the underdog to win outright was three years ago, when Tampa Bay upset Kansas City.
We’ll see if it changes using an Effective Yards Per Play method for calculating the score.
Overall Game Score using Effective Yardage Calculations
Overall Time of Possession/Forecasted Scrimmage Plays
Kansas City’s Effective Time of Possession forecast: 31.75 minutes
San Francisco’s Effective Time of Possession forecast: 31.21 minutes
Naturally we can’t have more than 60 minutes projected for SB LVIII. Adjusted for a 60-minute game, here are the forecasts:
Kansas City: 30.25 minutes (or 30:15)
San Francisco: 29.75 minutes (or 29:45)
Over the last 10 meaningful games, Kansas City has averaged 2.05 plays per minute of possession while San Francisco has averaged 1.91 plays per minute. Thus, the expected number of plays run by each team in SB LVII would be as follows:
Kansas City: 62.0 plays
San Francisco: 56.8 plays
Moving now to the Effective Yards per Play calculations for the L10 games, using the same method I did for the scoring, here are the games forecasts for SB LVIII:
Kansas City Offensive Yards per Play Forecast: 6.21
San Francisco Offensive Yards per Play Forecast: 6.04
Kansas City Defensive Yards per Play Forecast: 4.27
Philadelphia Defensive Yards per Play Forecast: 5.86
By the way, before going on to any final yardage calculation, I must interject and share that the KC defensive yardage forecast is the lowest I’ve projected in the Super Bowl game since starting this method.
Using the 2/3 offense, 1/3 defense formula, here are the forecasted total yards per play for SB LVIII:
Kansas City: 6.09 YPP
San Francisco: 5.45 YPP
Thus, the TOTAL YARDAGE PROJECTIONS based upon plays run multiplied by expected yards per play would be as follows:
Kansas City: 377.6 total yards
San Francisco: 309.6 total yards
Applying Effective Yards per Point totals for the teams obtained over the L10 meaningful games this season using the same 2/3 offense, 1/3 defense ratio, the score forecasted with the yardage method would be:
L10 Games Effective Yardage Score Forecast:
Kansas City 25.7
San Francisco 15.19
This projection is much lower on the total than the score method, and in this one, Kansas City would be an even bigger favorite of 10.5 points. It is indicating that the Chiefs would win the yardage battle by about 68 yards. This has the yards per point component built into it so turnovers are a part of that. This method really highlights how well the Chiefs defense has played in recent games, really limiting some of the league’s top offenses along the way.
Projecting the Team Stats
At this point in the season, you have to believe that the coaching staffs for both teams will try to generally stick with the recipe that got them to the Super Bowl. Using the assumptions made above in that Kansas City would total 377.6 yards on 62 plays and San Francisco would gain 309.6 yards on 56.8 plays, the number of runs and passes for each team would be broken up as follows:
Kansas City runs: 29.7 runs (Effective Run% 47.9%)
Kansas City passes: 32.3 passes (Effective Pass% 52.1%)
San Francisco runs: 23.7 runs (Effective Run% 41.8%)
San Francisco passes: 33.1 passes (Effective Pass% 58.2%)
Using the consistent 2/3 offense, 1/3 defense rules that I’ve applied, here are the expected rushing & passing yards per attempt and total yards for the two teams:
Kansas City: 4.36 YPR for 129.5 Yards Rushing
San Francisco: 4.87 YPR for 115.4 Yards Rushing
Kansas City: 7.68 PYA for 248.1 Yards Passing (263.7 accounted for QB before 2.4 sacks projected)
San Francisco: 5.87 PYA for 194.3 Yards Passing (213.2 accounted for QB before 2.9 sacks projected)
With Effective Completion Percentages of KC 65.5% & SF 65.8%, the expected number of completions would be:
Kansas City: 19.6 completions (on 29.9 actual throws)
Philadelphia: 19.9 completions (on 30.2 actual throws)
You now have all of the key team stat projections I will use below for forecasting the individual contributions to those totals.
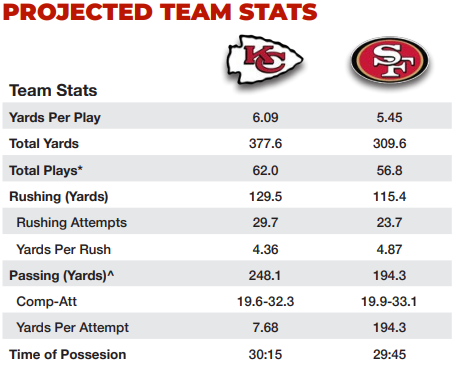
Note: Yards per play, total yards projected using 2/3 Offense, 1/3 Defense formula
Projecting the Individual Stats
Quarterbacks’ Passing Stats
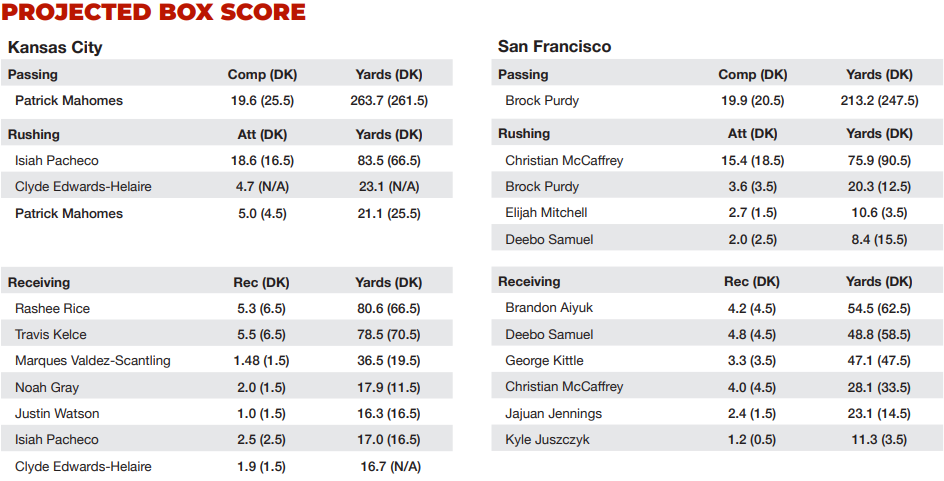
I’ve basically already laid out the projected stats for the quarterbacks above. Here they are redisplayed with the actual prop odds according to DraftKings (DK) as of Monday 2/5/24 and the projected wager:
Completions:
Patrick Mahomes (KC) – projection 19.6 (DK odds: 25.5) – UNDER
Brock Purdy (SF) – projection 19.9 (DK odds: 20.5) – UNDER
Passing Yards:
Patrick Mahomes (KC) – projection 263.7 (DK odds: 261.5) – OVER
Brock Purdy (SF) – projection 213.2 (DK odds: 247.5) – UNDER
Quarterbacks Rushing Stats
Here are the projections for rush yards for the two starting quarterbacks:
Rushing Attempts:
Patrick Mahomes (KC) – projection 5.0 (DK odds: 4.5) – OVER
Brock Purdy (SF) – projection 3.6 (DK odds: 3.5) – OVER
Rushing Yards:
Patrick Mahomes (KC) – projection 21.1 (DK odds: 25.5) – UNDER
Brock Purdy (SF) – projection 20.3 (DK odds: 12.5) – OVER
Running Backs’ Rushing Stats
Here are my forecasted running backs’ rushing stats based upon recent trends and the stats projected earlier:
Rushing Attempts:
Isiah Pacheco (KC) – projection 18.6 (DK odds: 16.5) – OVER
Clyde Edwards-Helaire (KC) – projection 4.7 (DK odds: N/A) – N/A
Christian McCaffrey (SF) – projection 15.4 (DK odds: 18.5) – UNDER
Deebo Samuel (SF) – projection 2.0 (DK odds: 2.5) – UNDER
Elijah Mitchell (SF) – projection 2.7 (DK odds: 1.5) – OVER
Rushing Yards:
Isiah Pacheco (KC) – projection 83.5 (DK odds: 66.5) – OVER
Clyde Edwards-Helaire (KC) – projection 23.1 (DK odds: N/A) – N/A
Christian McCaffrey (SF) – projection 75.9 (DK odds: 90.5) – UNDER
Deebo Samuel (SF) – projection 8.4 (DK odds: 15.5) – UNDER
Elijah Mitchell (SF) – projection 10.6 (DK odds: 3.5) – OVER
Running Backs’ Receiving Stats
Here are my forecasted running backs’ receiving stats based upon recent trends and the stats projected earlier:
Receptions:
Isiah Pacheco (KC) – projection 2.5 (DK odds: 2.5) – UNDER (Over vig -166)
Clyde Edwards-Helaire (KC) – projection 1.9 (DK odds: 1.5) – OVER
Christian McCaffrey (SF) – projection 4.0 (DK odds: 4.5) – UNDER
Kyle Juszczyk (SF) – projection 1.2 (DK odds: 0.5) – OVER
Receiving Yards:
Isiah Pacheco (KC) – projection 17 (DK odds: 16.5) – OVER
Clyde Edwards-Helaire (KC) – projection 16.7 (DK odds: N/A) – N/A
Christian McCaffrey (SF) – projection 28.1 (DK odds: 33.5) – UNDER
Kyle Juszczyk (SF) – projection 11.3 (DK odds: 3.5) – OVER
Wide Receiver/Tight End Receiving Stats
Here are my forecasted wide receiver & tight end receiving stats based upon recent trends and the stats projected earlier:
Receptions:
Travis Kelce (KC) – projection 5.5 (DK odds: 6.5) – UNDER
Marques Valdez-Scantling (KC) – projection 1.48 (DK odds: 1.5) – UNDER
Justin Watson (KC) – projection 1.0 (DK odds: 1.5) – UNDER
Noah Gray (KC) – projection 2.0 (DK odds: 1.5) – OVER
Rashee Rice (KC) – projection 5.3 (DK odds: 6.5) – UNDER
Brandon Aiyuk (SF) – projection 4.2 (DK odds: 4.5) – UNDER
Deebo Samuel (SF) – projection 4.8 (DK odds: 4.5) – OVER
Jauan Jennings (SF) – projection 2.4 (DK odds: 1.5) – OVER
George Kittle (SF) – projection 3.3 (DK odds: 3.5) – UNDER
Receiving Yards:
Travis Kelce (KC) – projection 78.5 (DK odds: 70.5) – OVER
Marques Valdez-Scantling (KC) – projection 36.5 (DK odds: 19.5) – OVER
Justin Watson (KC) – projection 16.3 (DK odds: 16.5) – UNDER
Noah Gray (KC) – projection 17.9 (DK odds: 11.5) – OVER
Rashee Rice (KC) – projection 80.6 (DK odds: 66.5) – OVER
Brandon Aiyuk (SF) – projection 54.5 (DK odds: 62.5) – UNDER
Deebo Samuel (SF) – projection 48.8 (DK odds: 58.5) – UNDER
Jauan Jennings (SF) – projection 23.1 (DK odds: 14.5) – OVER
George Kittle (SF) – projection 47.1 (DK odds: 47.5) – UNDER